
World ocean circulation model. U. S. Naval Postgraduate School, 1988. Wikimedia
As predictions of global heating and its innumerable ramifications become ever more urgent, the underlying science and how it is constructed and contested are of increasing public import. Since the 1950s scientists have been developing and refining computational models of the Earth’s climate, and how anthropogenic emissions will affect the environment. These models provide the Intergovernmental Panel on Climate Change (IPCC) with a core part of the scientific basis for assessing climate change. While the models do not predict exact future states owing to the inherent unpredictability of climate systems and limitations in current scientific knowledge, they enable researchers to observe the range of probable climate outcomes given different scenarios of global socioeconomic development.
Since its establishment in 1988 the IPCC has published cyclical assessment reports covering the current state of science, an evaluation of impacts of climate change, and the actions required to mitigate its effects. As part of the scientific basis, climate research teams from around the world contribute the results of specified experiments to the Coupled Model Intercomparison Project (CMIP). For each IPCC cycle, CMIP summarises and aggregates the outputs of all the models, and publishes them in a standard format. One of the reasons for analysing submissions from multiple research teams is that the models behave slightly differently from each other, providing a range of results and a comparison of performance. The models are also validated against historic climate data, and will typically include a run from around 1850 to the present, as well as future predictions from the present up until 2100 and beyond. As the science and the modelling technologies advance, so the specification of the experiments becomes more complex.

IPCC Climate Change 2014 Synthesis Report. Figure SPM.7. Change in average surface temperature (a) and change in average precipitation (b) based on multi-model mean projections.
The core findings of CMIP projects are published as part of the IPCC summary reports, which chart factors such as average surface temperature, precipitation, and CO2 emissions and concentrations over decadal periods. It is these summary charts, along with the visualisations produced by the climate research teams themselves which comprise the main visual language for quantifying the climate crisis in forms accessible to policy makers and the public.
These images, although outwardly seamless, and not unlike familiar weather charts, conceal a vast heterogeneous complex of scientific bodies of knowledge, institutional networks, and an observational infrastructure that stretches across the planet. The climate models themselves have grown incrementally since the earliest days of computing, consisting of couplings and hierarchies of software machines, each component describing a process of the Earth system. As part of our research we aim to shed light on this infrastructure, and in so doing reveal a phenomenology of climate and of climatology.
Historic development
In his book 'A Vast machine', Paul N Edwards outlines the scientific, technical and institutional innovations that were necessary for the earliest models. With access to early computer systems, an accumulation of global meteorological data, and theories about the physical equations governing the atmosphere, climatologists started to programme simple simulations of long term climate phenomena. They were new representations of the Earth, machines capable of performing climate experiments.
If you can simulate the climate, you can do experiments. God-like, you can move the continents, make the sun flare up or dim, add or subtract greenhouse gases, or fill the stratosphere with dust. You can cook the Earth, or freeze it, and nobody will even complain. Then you can watch and see what happens. [Edwards, 2010, p.139]
The history of climate model development has involved both progress in modelling independent components of the climate system, and their integration as a whole. Beginning with meteorological models of the atmosphere in the 1950s, scientists have created simulations of ocean physics, sea ice, atmospheric chemistry, and the processes of the carbon cycle. These components are ‘coupled’ together to form a modular Earth System Model. The computing resources required to design and run these experiments is significant, and globally there continue to be relatively few research teams contributing to the CMIP protocols. Examples include the National Center for Atmospheric Research (NCAR), and Geophysical Fluid Dynamics Laboratory (GFDL) in the US, the Hadley Centre in the UK, and the Meteorological Research Institute (MRI) in Japan. These institutions form a network and throughout the history of the research effort, computer code and mathematical models have circulated between them, as charted by Edwards [2010, p167]. As scientific theory and computing technologies have evolved new classes of climate models have emerged, each further elaborating our understanding of climate systems.

Historic development of global coupled climate models showing approximate timeline of component integration. Based on the work of Dr Gavin Schmidt and Rosamund Pearce graphic for Carbon Brief.
Energy Balance
One of the central concepts of climate modelling is the energy budget of the Earth, an analysis of the energy entering the system from the sun and leaving the Earth into space. Predictions of changes in climate are derived from an imbalance in this energy budget. Energy Balance Models (EBMs) do not model the dynamics of the atmosphere, at their simplest they are zero-dimensional and the earth is treated as a point in space.
Over the course of the 1970s a number of prominent papers used EBMs and considerations of greenhouse gases to predict the impact of CO2 on global warming. In 1972 John Sawyer at the UK’s Met Office published a paper in Nature ‘Man-made Carbon Dioxide and the “Greenhouse” Effect‘ [Sawyer, 1972], and Columbia University’s Wally Broecker published ‘Climatic Change: ‘Are We on the Brink of a Pronounced Global Warming?’ in 1975. Using this relatively simple model Sawyer estimated global warming over the period 1969 to 2000 at a figure of 0.6C, slightly over the observed figure of between 0.51C and 0.56C.
General Circulatory Models
Following innovations in numerical weather prediction in the 1940s and 1950s and meteorological data providing a sketchy outline of the atmosphere’s circulatory systems, researchers at centres including GFDL, NCAR and UCLA started to experiment with the first computer simulations. In addition to the energy equations used by EBMs, general circulatory models (GCMs) consider the atmospheric flows resulting from the interactions of planetary rotation, gravitation, humidity, sea surface temperature and other factors. The circulatory dynamics of the oceans and their energy exchange with the atmosphere also have a profound effect on climate. For this reason contemporary models couple the atmospheric component (AGCM) with an ocean model. These coupled models are referred to as AOGCMs.
As spatial representations of the Earth, GCMs partition the atmosphere and oceans into a three dimensional grid, each cell containing a number of climate related variables. The GCMs compute how the grid cells, and hence the climate, is predicted to change given a set of conditions or 'parameters'. At each step of the simulation values for variables such as wind speed, heat transfer and CO2 concentration are calculated for each grid cell. The models are based on equations from physics, chemistry and biology that describe the relationships between the entities of the system. For example, the Navier-Stokes equation provides solutions to fluid flow in the atmosphere and oceans given parameters such as fluid density, pressure and viscosity. Other processes might include equations for the formation of clouds, and the melting of sea ice.

GFDL ESM2M atmosphere grid with CO2 isovolume threshold from average to maximum concentration
As the model is spun up and gradually reaches the equilibrium, the behaviour of meteorological and ocean systems emerge from the underlying equations. The simulation is not programmed with information about how global circulatory patterns will evolve, they are the result of interactions between the modelled processes.
In addition to the emergent behaviour internal to the models, scientists provide information about external factors that affect the energy of the climate system, such as variations in solar radiation, volcanic eruptions, land usage, and concentrations of greenhouse gases. These are known as radiative forcings, they have an effect on the difference between energy from the sun absorbed by the Earth and energy radiated back to space. It is these imbalances in the energy of the system that gives rise to changes in climate.
Scientists can vary these inputs in order to analyse what happens when there is an increase in the concentration of atmospheric CO2. Experiments can be run on the same model for a wide variety of anthropogenic emission scenarios, and for the standard diagnostics tests of climate sensitivity. These include an abrupt doubling of CO2 from pre-industrial levels (equilibrium climate sensitivity), and an increase of 1% a year until the concentration doubles (transient climate response).
A frequently cited paper based on GCM research is James Hansen’s 1988 'Global Climate Changes as Forecast by Goddard Institute for Space Studies Three-Dimensional Model' [Hansen 1988]. The NASA GISS model simulated aerosols, basic cloud dynamics, CO2 and other greenhouse gases, including halocarbons that were subsequently restricted under the Montreal Protocol (1987). In the same year Hansen appeared before a Senate subcommittee and announced that he was "99 percent" sure that" global warming is affecting our planet now”, and that there is a strong "cause and effect relationship" between observed temperatures and human emissions. [Kolbert, 2006, p.101].
Statements of such political importance have led to scrutiny of the research methodologies and the inferences drawn from the experiments. Simulations necessarily simplify the processes they model, and there are always known areas of uncertainty. While there is an extensive literature on the subject, a couple of central issues include model resolution, and the techniques by which small scale phenomena that can’t be directly simulated, are described by mathematical functions or 'parameterisations'.
Gridding the Earth
Owing to the constraints of even the most powerful hardware, there are limitations on spatial and temporal resolutions of the models. Early simulations were based on relatively coarse grids, for example, UCLA’s GCM completed in 1963 had two vertical levels and a resolution of 7 degrees latitude by 9 degrees longitude. Typically global models submitted for the CMIP5 experiments (2008-2014) were calculated on grid scales of between 1 and 3 degrees of longitude and latitude, with between 15 and 50 levels vertically partitioning the atmosphere, and the oceans. The levels are more tightly spaced near the Earth's surface than at altitude and depth. A single cell at the equator is 111 Km sq, and 1 Km high at mid altitudes, meaning that most countries are covered by only a small number of cells.
Simpler models of individual components, such as the physics of the ocean can be created at a much higher resolution. Outputs of the oceanic Nemo model [Nemo, n.d.] are at 1/12 of a degree which enables the formation of phenomena like mesoscale eddies that do not appear on coarser grids. Similarly, HiRAM [HiRAM, n.d.] is an example of a high resolution atmospheric model design to accurately capture the distribution and frequency of global hurricane tracks.
The necessarily coarse grid of coupled models has the corollary that some geographies disappear altogether. In an interview for Carbon Brief, Prof Michael Taylor, a senior lecturer at the University of the West Indies, notes that smaller Caribbean islands can fall entirely within a grid cell and are thus represented as ocean within the model.
Carbon Brief :How do climate models work?, Prof Michael Taylor [McSweeney,2018]
To perform more localised analysis the technique of downscaling can be employed, in which the outputs of a global scale GCM are input to a finer resolution Regional Climate Models (RCM) covering the area of interest. While there is debate amongst scientists about the accuracy of the method [Benestad, 2016. Cooney, 2012], it remains of great importance to utilise the data from the global scale to run local analysis of impacts at localised level. Geographers and social scientists have argued the case for collaborations between climate scientists and interdisciplinary teams with specific knowledge of their locale [Colvern 2019].
Parameterisation
The scale of the grid is significant in terms of how the model variables are calculated. Phenomena that occur on a scale larger than the grid size can be directly 'simulated' from scientific principles, tropical cyclones are one such example. Processes that take place on a smaller scale need to be 'parameterized', in this case observational data, statistics and other mathematical modelling techniques form part of the calculation. Examples of parameterized processes include cloud formation, the radiative transfer of both gases and solids, and the albedo of sea ice.

GFDL Cloud microphysics diagram. [S.-J. Lin, 2018]
One of the main areas of scientific uncertainty in climate modelling is cloud formation. Clouds develop from "complicated interactions between large-scale circulations, moist convective transport, small-scale turbulent mixing, radiation, and microphysical processes" [Edwards, 2010]. They can both warm and cool the planet depending on the type of cloud and the time of day. Individual clouds can form and disappear rapidly, and their structures are smaller than the most high resolution models. In order to represent this on the grid, GCMs typically use a ‘cloud fraction’ variable indicating the percentage of a grid cell cloud coverage. Given that a cell is greater than 100Km squared, the functions describing the cloud formations require significant simplifications and approximations [McSweeney, 2018].

OpenCell Clouds. MODIS 30 September 2005
A contemporary GCM model might contain thousands of parameterisations, many of which are as complex as cloud formation. This issue is compounded by the fact that simulations rely on the interactions between all of these processes.
Earth System Models and the Carbon Cycle
The most recent development in climate modelling is the class of Earth System Models (ESMs) which integrate the chemical and biological processes of the global carbon cycle with the physical climate of the atmosphere and oceans. A number of models submitted to CMIP5 and the specialised Carbon Cycle MIP (C4MIP) included dynamic models of terrestrial and ocean biogeochemistry.
Research into modelling marine ecosystems and land vegetation has progressed independently of GCMs, branches of which have more recently been developed as integral parts of ESMs. Each ESM project is coupled with a particular set of biogeochemical models, for example the UKESM utilises the MEDUSA marine ecosystem model, and the JULES land surface model with TRIFFID dynamic vegetation. Note that the terrestrial model itself has nested components, an analysis of land use linked with vegetation modelling.
The land ecosystem component is an example of a ‘Dynamic global vegetation model’ (DGVM), which describes changes to the terrestrial environment in relation to climate. This includes shifts in vegetation types and coverage, the carbon and nitrogen pools of the ecosystem, disturbance factors like wildfires, and carbon fluxes such as photosynthesis. Similar to physical climate model components DGVMs require time to spin up. Starting from a bare ground initial state the experiment is ready to begin when the model reaches an equilibrium ecosystem state that corresponds to observed historical vegetation cover. One of the sources of validation data is Moderate Resolution Imaging Spectroradiometer (MODIS) satellite imagery, from which leaf area indices are derived.
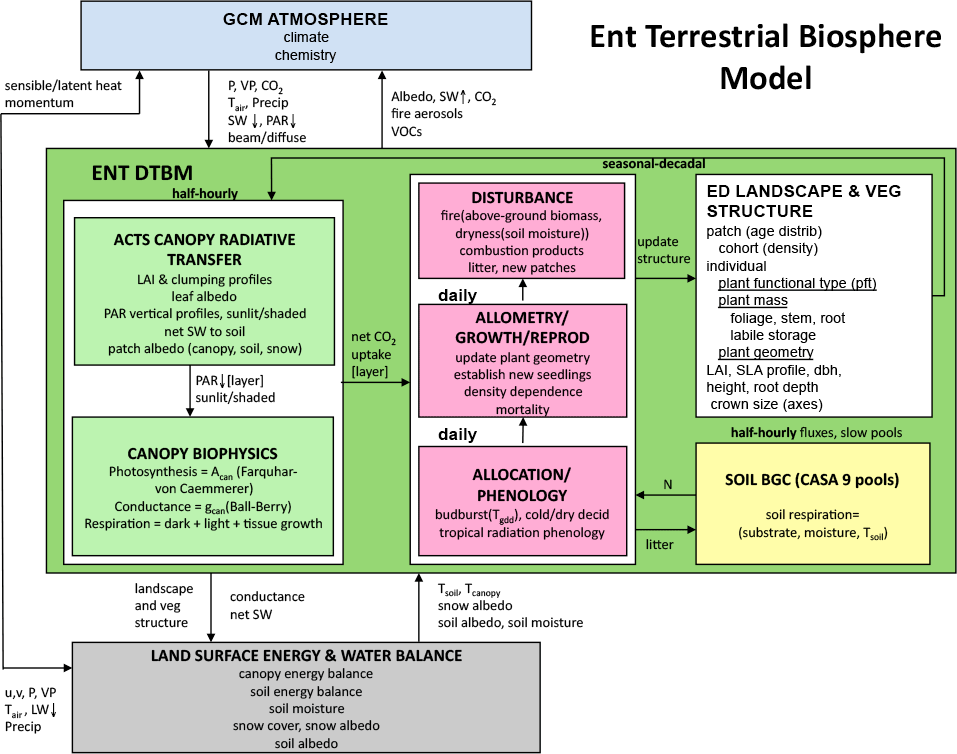
Dynamic global vegetation model diagram: Ent Dynamic Terrestrial Biosphere Model from NASA Goddard Institute for Space Studies. https://www.giss.nasa.gov/projects/ent/
In order to simplify the enormous complexity of an ecosystem, scientists make decisions about which features to capture and how to model them. Vegetation simulations might include mathematical descriptions of photosynthesis, stomatal conductance (the rate of CO2 entering the stomata of leaves), competition between vegetation types, patterns of establishment, and factors causing mortality. Each of these processes can be parameterised according to different methodologies, and are dependent on other variables of the model.

MODIS satellite imagery: Vegetation and burn scars in Bolivia
Carbon-cycle Feedbacks
One of the uncertainties facing models currently being developed for the CMIP6 protocol are carbon-cycle feedbacks. Increases in temperature as a result of CO2 emissions lead to changes in the behaviour of the carbon cycle, which in turn have an impact on temperature. Global warming reduces the absorption of CO2 by the ocean surface, and the carbon sequestered in soils. It can also accelerate tree death and the prevalence of wildfires. Another phenomenon is the thawing of permafrost which releases methane into the atmosphere. The net effect of these processes is that more greenhouse gases remain in the atmosphere.
A further complication is that not all of the feedback effects are self-reinforcing. For example, the rate of photosynthesis increases in CO2 rich environments, which can lead to additional vegetation growth, and thereby sequester more carbon. In addition the land update of carbon is enhanced by both large scale anthropogenic emissions of nitrogen (e.g. fertilisers), and changes to the nitrogen cycle due to warming.
Attempts have been made to model these carbon-cycle uncertainties by a number of research centres contributing to the C4MIP protocol. In 2017 the Hadley Centre’s Ben Booth explored a range of land and ocean biogeochemisty parameters using the Hadley HadCM3C model (Booth, 2017). Using only those models with parameter variations conforming to historic observations, a wide range of potential CO2 concentration outcomes was observed, particularly for higher emissions scenarios. The upshot of this is that uncertainties due to carbon-cycle feedbacks lead to a greater range of possible warming outcomes than had been seen in the previous generation of CMIP5 climate models [Hausfather, 2020].
Conclusion
This brief survey highlights some of the infrastructure, science and technologies that underlie the process of climate forecasting. One of the challenges faced by scientists is that the vast diversity of the Earth’s climate and carbon-cycle phenomena are interconnected, which means that it’s impossible to isolate a locale or an individual system for analysis without considering the dynamics of the whole [McSweeney, 2018]. Downscaling techniques can be used for finer grain localised studies, but they are informed by the outputs of a global model. As the simulations increase in complexity and the effects of feedbacks are gradually incorporated, the level of uncertainty also increases and the severity of the worst case scenarios.
While the models are a simplification and necessarily abstract the richness of the Earth’s systems, they reveal the otherwise invisible and intangible phenomena that are crucial for our ability to understand the impact of GHG emissions. An aim of the research is to make tangible some of the intricacies of this introspection of our planet.
References
Benestad, R (2016). Downscaling Climate Information [Online]. Available at https://oxfordre.com/climatescience/view/10.1093/acrefore/9780190228620.001.0001/acrefore-9780190228620-e-27 [Accessed 1st May 2020].
Cooney, CM (2012). Downscaling Climate Models: Sharpening the Focus on Local-Level Changes [Online]. Available at https://www.ncbi.nlm.nih.gov/pmc/articles/PMC3261962/ [Accessed 1st May 2020].
Colven E, Thomson MJ. (2019), Bridging the divide between human and physical geography: Potential avenues for collaborative research on climate modeling. Geography Compass. 2019;13:e12418 [Online]. Available at https://doi.org/10.1111/gec3.12418 [Accessed 1st June 2020]
Edwards, PN (2010). A Vast Machine: Computer Models, Climate Data, and the Politics of Global Warming. Cambridge, Mass. MIT Press.
Hansen, J et al (1988). Global Climate Changes as Forecast by Goddard Institute for Space Studies Three-Dimensional Model. Journal of Geophysics research. Vol. 93, No D8. Pages 9341 - 9364 [Online] Available at https://pubs.giss.nasa.gov/docs/1988/1988_Hansen_ha02700w.pdf [Accessed 1st June 2020]
Hausfather, Z and Betts, R (2020) How ‘carbon-cycle feedbacks’ could make global warming worse. Carbon Brief [Online]. Available at https://www.carbonbrief.org/analysis-how-carbon-cycle-feedbacks-could-make-global-warming-worse [Accessed 1st June 2020].
HiRAM, (n.d.). HiRAM (HIgh Resolution Atmospheric Model) [Online]. Available at https://www.gfdl.noaa.gov/hiram/ [Accessed 1st May 2020].
S.-J. Lin, (2018). An Efficient Integrated Dynamics-Physics Coupling Strategy for Global Cloud-Resolving Models. NOAA/Geophysical Fluid Dynamics Laboratory, Princeton. [Online]
Available at https://www.ecmwf.int/en/elibrary/18403-efficient-integrated-dynamics-physics-coupling-strategy-global-cloud-resolving [Accessed 1st June 2020].
Kolbert, Elizabeth (2006). Field Notes from a Catastrophe : Man, Nature, and Climate Change. New York :Bloomsbury Pub. : Distributed to the trade by Holtzbrinck Publishers.
Nemo, (n.d). About NEMO [Online]. Available at https://www.nemo-ocean.eu/ [Accessed 1st May 2020].
McSweeney, R and Hausfather, Z (2018). Q&A: How do climate models work? Carbon Brief [Online]. Available at https://www.carbonbrief.org/qa-how-do-climate-models-work [Accessed 1st May 2020].
Sawyer JS (1972), ‘Man-made Carbon Dioxide and the “Greenhouse” Effect‘. Nature Vo;. 239 [Online]. Available at https://sites.fas.harvard.edu/~eps5/writing_assignment/CLIMATE_BKGD/Sawyer_Nature_1972.pdf [Accessed 1st June 2020]